Key WHS statistics 2026: what they mean for workforce competency and risk management
Competency Management
Enterprise
Assessment & Compliance
Key WHS statistics 2026: what they mean for workforce competency
Safe Work Australia released Key Work Health and Safety Statistics Australia 2026 on 12 October 2026. The report shows 222 workers died from traumatic injuries at work in 2025, the highest annual number since 2012. There were also 147,200 serious workers’ compensation claims in 2024–25. This article summarises the key WHS statistics for 2026 and what they mean for organisations managing workforce competency and authorisation in high-risk industries. It also covers how aXcelerate Skills helps teams see who is competent, current and authorised for that work.
What do the 2026 WHS statistics show?
The 2026 report shows worker fatalities rose in 2025, while serious claims ran at more than 400 a day.The headline findings are:
222 worker fatalities in 2025, above the five-year average of 197. The fatality rate was 1.5 per 100,000 workers, against a five-year average of 1.4.
147,200 serious workers’ compensation claims in 2024–25, or more than 400 a day. These figures are preliminary and may be revised.
74% of fatalities and 61% of serious claims occurred in six industries: agriculture, forestry and fishing; public administration and safety; transport, postal and warehousing; manufacturing; health care and social assistance; and construction.
Vehicle incidents (41%), falls from a height (13%) and being hit by falling objects (9%) accounted for almost two-thirds of worker fatalities.
The longer-term trend is more encouraging. The fatality rate has fallen 15% since 2015, from 1.8 to 1.5 fatalities per 100,000 workers. Safe Work Australia also notes that annual fatality counts can vary widely and should be interpreted with caution.
Which industries and roles face the highest risk?
Transport, construction and agriculture accounted for almost two-thirds (63%) of worker fatalities in 2025:
Transport, postal and warehousing: 61 fatalities, at 8.3 per 100,000 workers
Construction: 41 fatalities, at 3.0 per 100,000 workers
Agriculture, forestry and fishing: 38 fatalities, at 13.0 per 100,000 workers
Across all industries, the fatality rate was 1.5 per 100,000 workers.
Construction
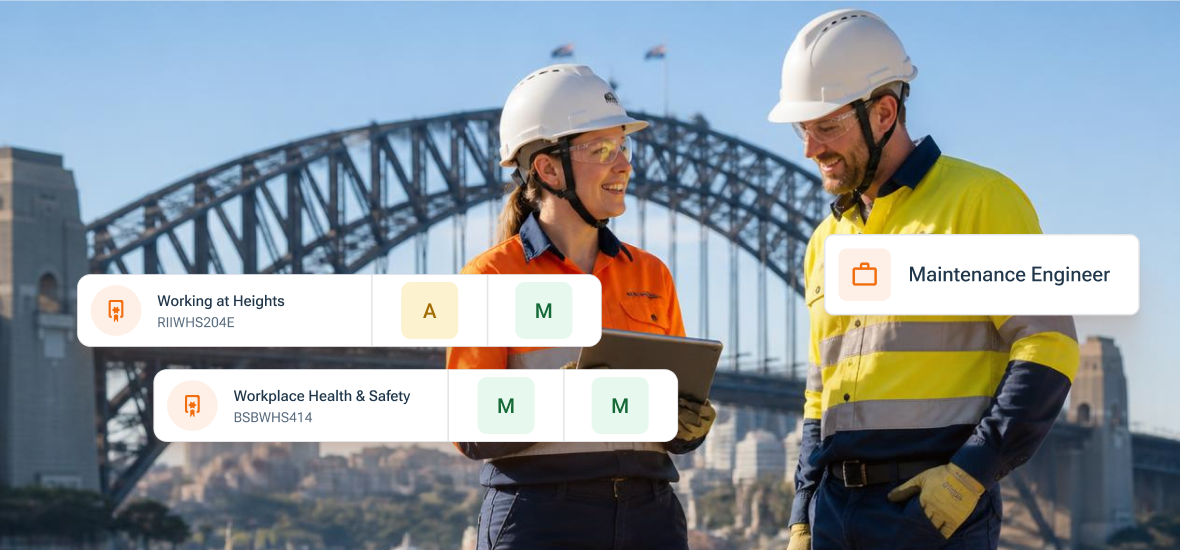
Construction recorded 41 worker fatalities in 2025, almost one in five nationally. Falls from a height have been the second most common cause of worker fatalities for three consecutive years. Deaths from being hit by falling objects rose from 13 in 2024 to 21 in 2025. Safe Work Australia notes this has coincided with high construction activity and ongoing labour shortages across construction trades. When crews change quickly, a skills matrix in aXcelerate Skills shows who holds current working-at-heights competencies across sites and contractor groups before work is assigned.
Machinery operators and drivers
Machinery operators and drivers accounted for 35% of worker fatalities in 2025 (77 deaths). Their fatality rate of 8.7 per 100,000 workers was almost six times the overall rate. These roles typically depend on current licences, tickets and site-specific authorisations. In aXcelerate Skills, each authorisation is linked to the competencies and documents beneath it. A lapsed licence or medical shows the authorisation as invalid without changing the worker’s training record.
Remote and regional work
Workers in Very Remote Australia were around eight times more likely to die from a work-related traumatic injury than the national average. This finding comes from Safe Work Australia’s analysis of 2019–2021 data. Safe Work Australia notes several factors that may contribute, including differences in industry, occupation and working environment, and distance from medical and emergency services.
Regional teams may need to cover a different range of skills than metropolitan teams, for example, an emergency services team in Northern Queensland may need crocodile safety straining . aXcelerate Skills lets organisations set competency profiles by role and region, so each worker is tracked against the requirements that apply where they work.
Serious claims by industry
Accounting for hours worked, six industries recorded serious claims frequency rates between 8.8 and 9.6 claims per million hours worked, against an all-industry average of 6.7. They were agriculture, forestry and fishing (9.6), health care and social assistance (9.5), manufacturing (9.4), public administration and safety (9.3), transport, postal and warehousing (9.1) and construction (8.8).
Mining tells a different story. Its claims frequency rate (6.2) sat below the average, but its claims were among the most severe. Median time lost was 11.5 weeks and median compensation paid was $38,500, compared with 8.2 weeks and $19,000 across all industries (2023–24 data).
How long does the impact of workplace harm last?
The impact of a serious workplace injury often lasts for years. Safe Work Australia’s analysis of HILDA survey data found that workers who spent a month or more off work after an injury reported general health about 8% lower and mental health about 7% lower afterwards. Five years later, both remained below pre-injury levels.
Return to work is also taking longer. The share of workers’ compensation claimants back at work within 52 weeks fell from 92.8% in 2014 to 87.0% in 2024 (noting that Safe Work Australia advises using this measure with caution).
For employers, longer absences mean more roles covered by other workers. Those workers also need to be competent, current and authorised for the work they step into. In aXcelerate Skills, managers can filter by site, role or contractor group to see who is authorised to cover a role. A training needs analysis then shows which gaps to close before they affect rostering.
What do the statistics mean for workforce competency?
The 2026 data shows most worker fatalities still come from a familiar set of causes, concentrated in a small number of industries and roles. Checking that every worker assigned to high-risk work is competent, current and authorised is one part of managing that risk.
Competency and authorisation are different
A competency is evidence that a worker can perform a task, such as a completed unit, licence or ticket. Many competencies carry an expiry date. An authorisation is the organisation’s permission for that worker to perform the task in a specific role or at a specific site. It depends on the right competencies staying current, along with requirements such as inductions and medicals.
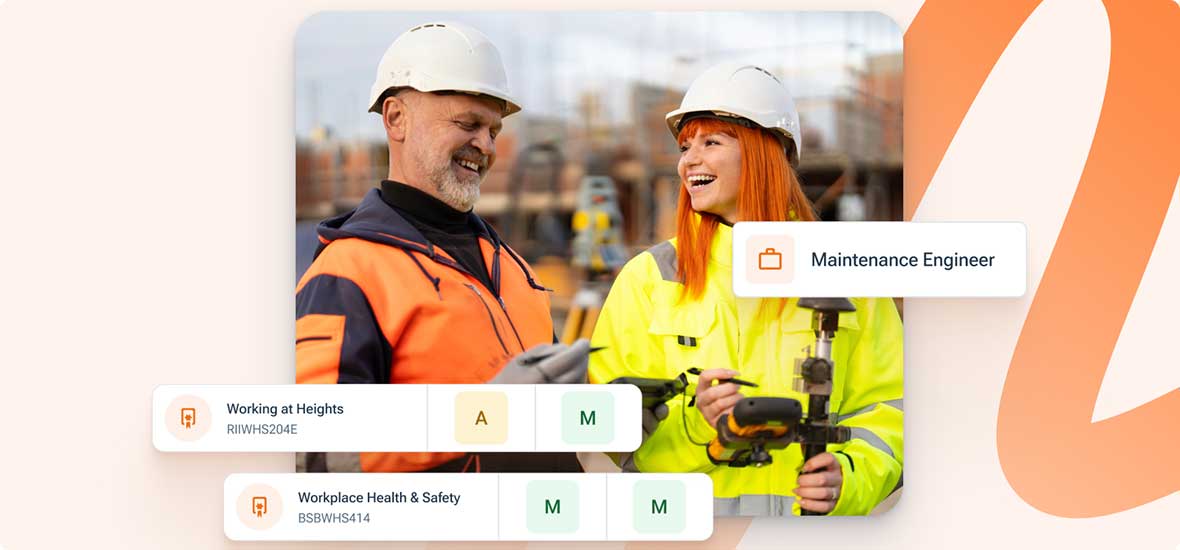
aXcelerate Skills manages competencies and authorisations as two separate, linked records. An authorisation’s status depends on its underlying competencies, documents and child authorisations, so it changes when any of them expire.
This means a worker can be qualified without being authorised. A useful way to think about readiness is as four steps: qualified, current, authorised and ready.
Five questions to ask about your workforce
If an auditor asked today, how long would it take to show who is current for your highest-risk tasks?
Which licences and tickets expire in the next 90 days, and does each worker know?
When someone changes role or site, how do you check their authorisations match the new work?
Are contractors and labour hire workers held to the same currency checks as employees?
Do volunteers and regional crews have the same visibility as metropolitan teams?
How aXcelerate Skills supports workforce visibility
aXcelerate Skills brings competency and authorisation records together in one place so WHS, L&D, operations and workforce development leaders can see who is qualified, current and authorised for each role, site and task.
One view of workforce readiness
Skills consolidates competency and authorisation data into dashboards and skills matrices. Leaders can filter by site, role or contractor group to see who is covered and who isn’t, and spot upcoming expiries without exporting to a spreadsheet. A training needs analysis compares the competencies each role requires against what is on file, so teams know who needs what before a project starts or a crew changes.
Rules that fit how you work
Teams set renewal intervals, evidence types and sign-off requirements by role, site and contractor group. Skills tracks each renewal deadline against those rules, flags what is coming due, and schedules renewals and escalations. Regional teams covering a broader range of skills and metropolitan teams with deeper specialisation can be managed on the same platform, each against the requirements that apply to them.
Evidence ready for audit
Every competency and authorisation carries its own evidence trail, including training records, assessments, observations and sign-offs. When an auditor or regulator asks how you know a worker is authorised, the evidence is already attached to the record.
The right view for each role
Contractors, site managers, safety officers and executives each get views and permissions suited to their role, drawn from the same underlying data. A site manager can check crew readiness before rostering, while an executive dashboard tracks measures such as the percentage of workers competent by site and the time it takes to authorise them.
Built on a training compliance platform
aXcelerate Skills is built on the aXcelerate platform, which Australian training providers use to manage accredited training, assessment evidence and compliance reporting. Skills applies the same approach to workforce competency: every record carries its evidence, and every expiry is tracked against a defined rule. Additionally, if your organisation delivers accredited training through its own RTO, those training records and your workforce competencies can be managed on one platform.
Chat to us at the Workplace Health & Safety Show Sydney
aXcelerate will be at the Workplace Health & Safety Show on 21–22 October 2026 at ICC Sydney. Visit us at stand G80 to talk through what the 2026 statistics mean for your workforce, and see how aXcelerate Skills tracks competency and authorisation status across sites, roles and contractor groups. Want to book a demo of aXcelerate Skills? Let us know via this form.
FAQ
Q: Which industry has the most workplace fatalities in Australia? A: Transport, postal and warehousing recorded the most worker fatalities in 2025, with 61 deaths. Construction (41) and agriculture, forestry and fishing (38) followed.
Q: What is the difference between competency and authorisation? A: A competency shows a worker can perform a task, such as a completed unit or licence. An authorisation is the organisation’s permission for that worker to perform the task in a specific role or site, and it depends on their competencies staying current.
Q: How can software help manage worker competency and authorisation? A: Workforce skills and competency management software, such as aXcelerate Skills, keeps competency records, expiry dates, authorisation requirements and supporting evidence in one place. It flags upcoming expiries so they can be renewed before they lapse.
Q: When are Australia’s WHS statistics released? A: Safe Work Australia publishes Key Work Health and Safety Statistics Australia each year. The 2025 and 2026 editions were both released in October, during National Safe Work Month.
Your aXcelerate Day 2026 Replay: What's New and What's Next
Missed aXcelerate Day 2026, or want a recap of everything we announced? Here's your replay: not just what's new, but what it means for how you run your organisation.
Business & Technology
19 Oct
2026
Key WHS statistics 2026: what they mean for workforce competency and risk management
The key WHS statistics for 2026 show 222 worker deaths and 147,200 serious claims. Here’s what the data means for workforce competency and authorisation.
Competency Management
Enterprise
Assessment & Compliance
26 Sep
2023
Compliance Reporting Made Easy: The aXcelerate Advantage
Join Madi and Jasmine from aXcelerate Customer Support as they delve into the pivotal role of compliance in education. Discover the risks of poor compliance processes and how aXcelerate's integrated system simplifies reporting with built-in pre-validation checks and consolidated data.
Assessment & Compliance
Business & Technology
VET and competency management insights, straight to your inbox
Your go-to source for industry updates and informative thought leadership.